Status Pages for Your Business
Build trust with real-time transparency. Give your customers a branded, always-accurate window into your service health — no engineering overhead required.
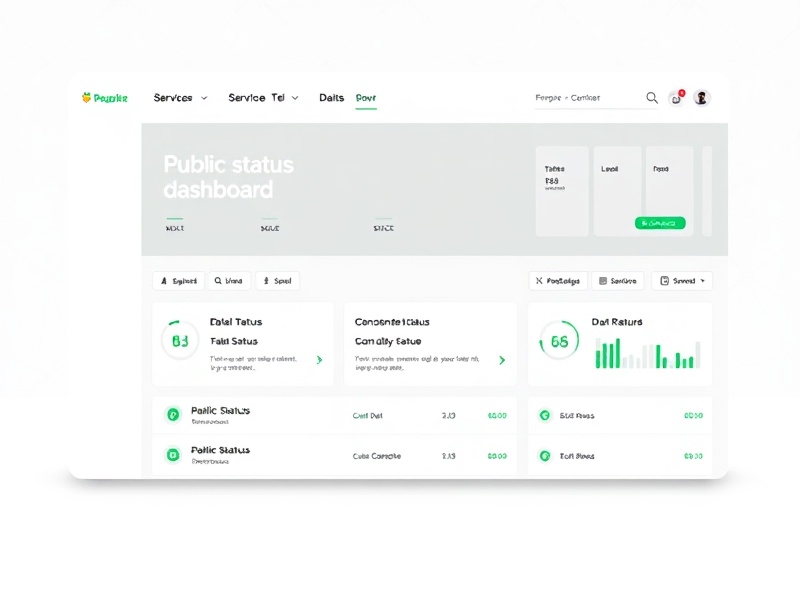
Live Preview
See a Status Page in Action
This is exactly what your customers will see — a clean, real-time dashboard showing uptime, incidents, and planned maintenance for every component you monitor.
Real-Time Component Status
Each monitored endpoint — API, database, CDN, auth service — gets its own live status indicator. Green, degraded, or down, with exact timestamps on every state change.
Incident Timeline
Automatically generated incident logs with severity levels, affected components, and resolution notes. Your team updates it; your customers read it. No more vague "we're looking into it" tweets.
30-Day Uptime History
Visual uptime graphs showing percentage availability per component over the last 30 days. Click any bar to drill into hourly detail. Perfect for SLA reporting and audits.
Branding & Custom Domain
Make It Yours — Down to the Domain
Your status page should look like it belongs to you, not like a generic widget. White-label it completely with your domain, logo, colors, and messaging.
Custom Domain
Point status.yourcompany.com or statuspage.io/yourbrand to your StatusPulse page. We provide CNAME records and handle SSL automatically via Let's Encrypt. No certificate management on your side.
Logo & Color Scheme
Upload your logo (SVG or PNG, max 500 KB), pick your primary and accent colors from a palette or enter hex codes directly. The header, status badges, and charts all adapt to your brand.
Custom Sections & Layout
Add a company description, link to your docs or support portal, and reorder components however you like. Pin important services to the top; group related endpoints under component sets like "Infrastructure" or "Third-Party Integrations."
Subscriptions & Notifications
Let Customers Subscribe to Updates
Give your users the option to opt in for email or SMS alerts when incidents occur or resolve. StatusPulse handles delivery, frequency capping, and unsubscribe management automatically.
Email & SMS Alerts
Subscribers choose their channel. Email goes through SendGrid (delivered in under 30 seconds); SMS via Twilio for critical outages. You set the severity thresholds — for example, SMS only for "Major Outage" and above.
Webhook & RSS Feeds
Every status page ships with an RSS feed and a raw JSON endpoint. Pipe incident updates into your Slack channel, PagerDuty, or internal dashboard. Support teams can monitor status without leaving their workflow.
Subscriber Analytics
See how many users subscribed, churn rate, and open rates for incident notifications. Export subscriber lists as CSV. Currently, customers like Meridian Cloud (12,400 subscribers) and Payflow Systems (8,200 subscribers) track engagement monthly.
Developer API
Programmatic Access to Everything
Manage status pages, components, incidents, and subscribers through a RESTful API. Integrate status page management into your CI/CD pipeline, incident response tooling, or internal ops dashboard.
REST API — 200+ Endpoints
Full CRUD for components, incidents, maintenance windows, and subscriber management. Rate-limited at 1,000 requests per minute on the Business plan. Authentication via API keys scoped to specific status pages.
SDKs & CLI
Official SDKs for Python (pip install statuspulse), Node.js, and Go. A CLI tool lets you create incidents from your terminal: statuspulse incident create --severity major --component api-gateway.
Webhooks for Automation
Trigger external actions on status changes. When a component flips to "Down," fire a webhook to your incident management system. When it recovers, auto-close the ticket. Used by teams at ScaleGrid, NovaPay, and 400+ other companies.